This guide walks you through day-to-day use of the Monitoring Visit module: navigating the dashboard, creating reports, managing issues, and moving reports through the approval workflow.
Path: Study Workspace → Monitoring Visit
Navigation Map
Here are the main screens you'll work with:
- Dashboard
- View site activity and monitoring metrics across the study
- Reports list
- Search, filter, export, and open individual reports
- Report detail
- Complete report sections, add comments/issues, and change status
- Configuration
- Set up visit types, CRF templates, and notification rules (admin only)
Dashboard
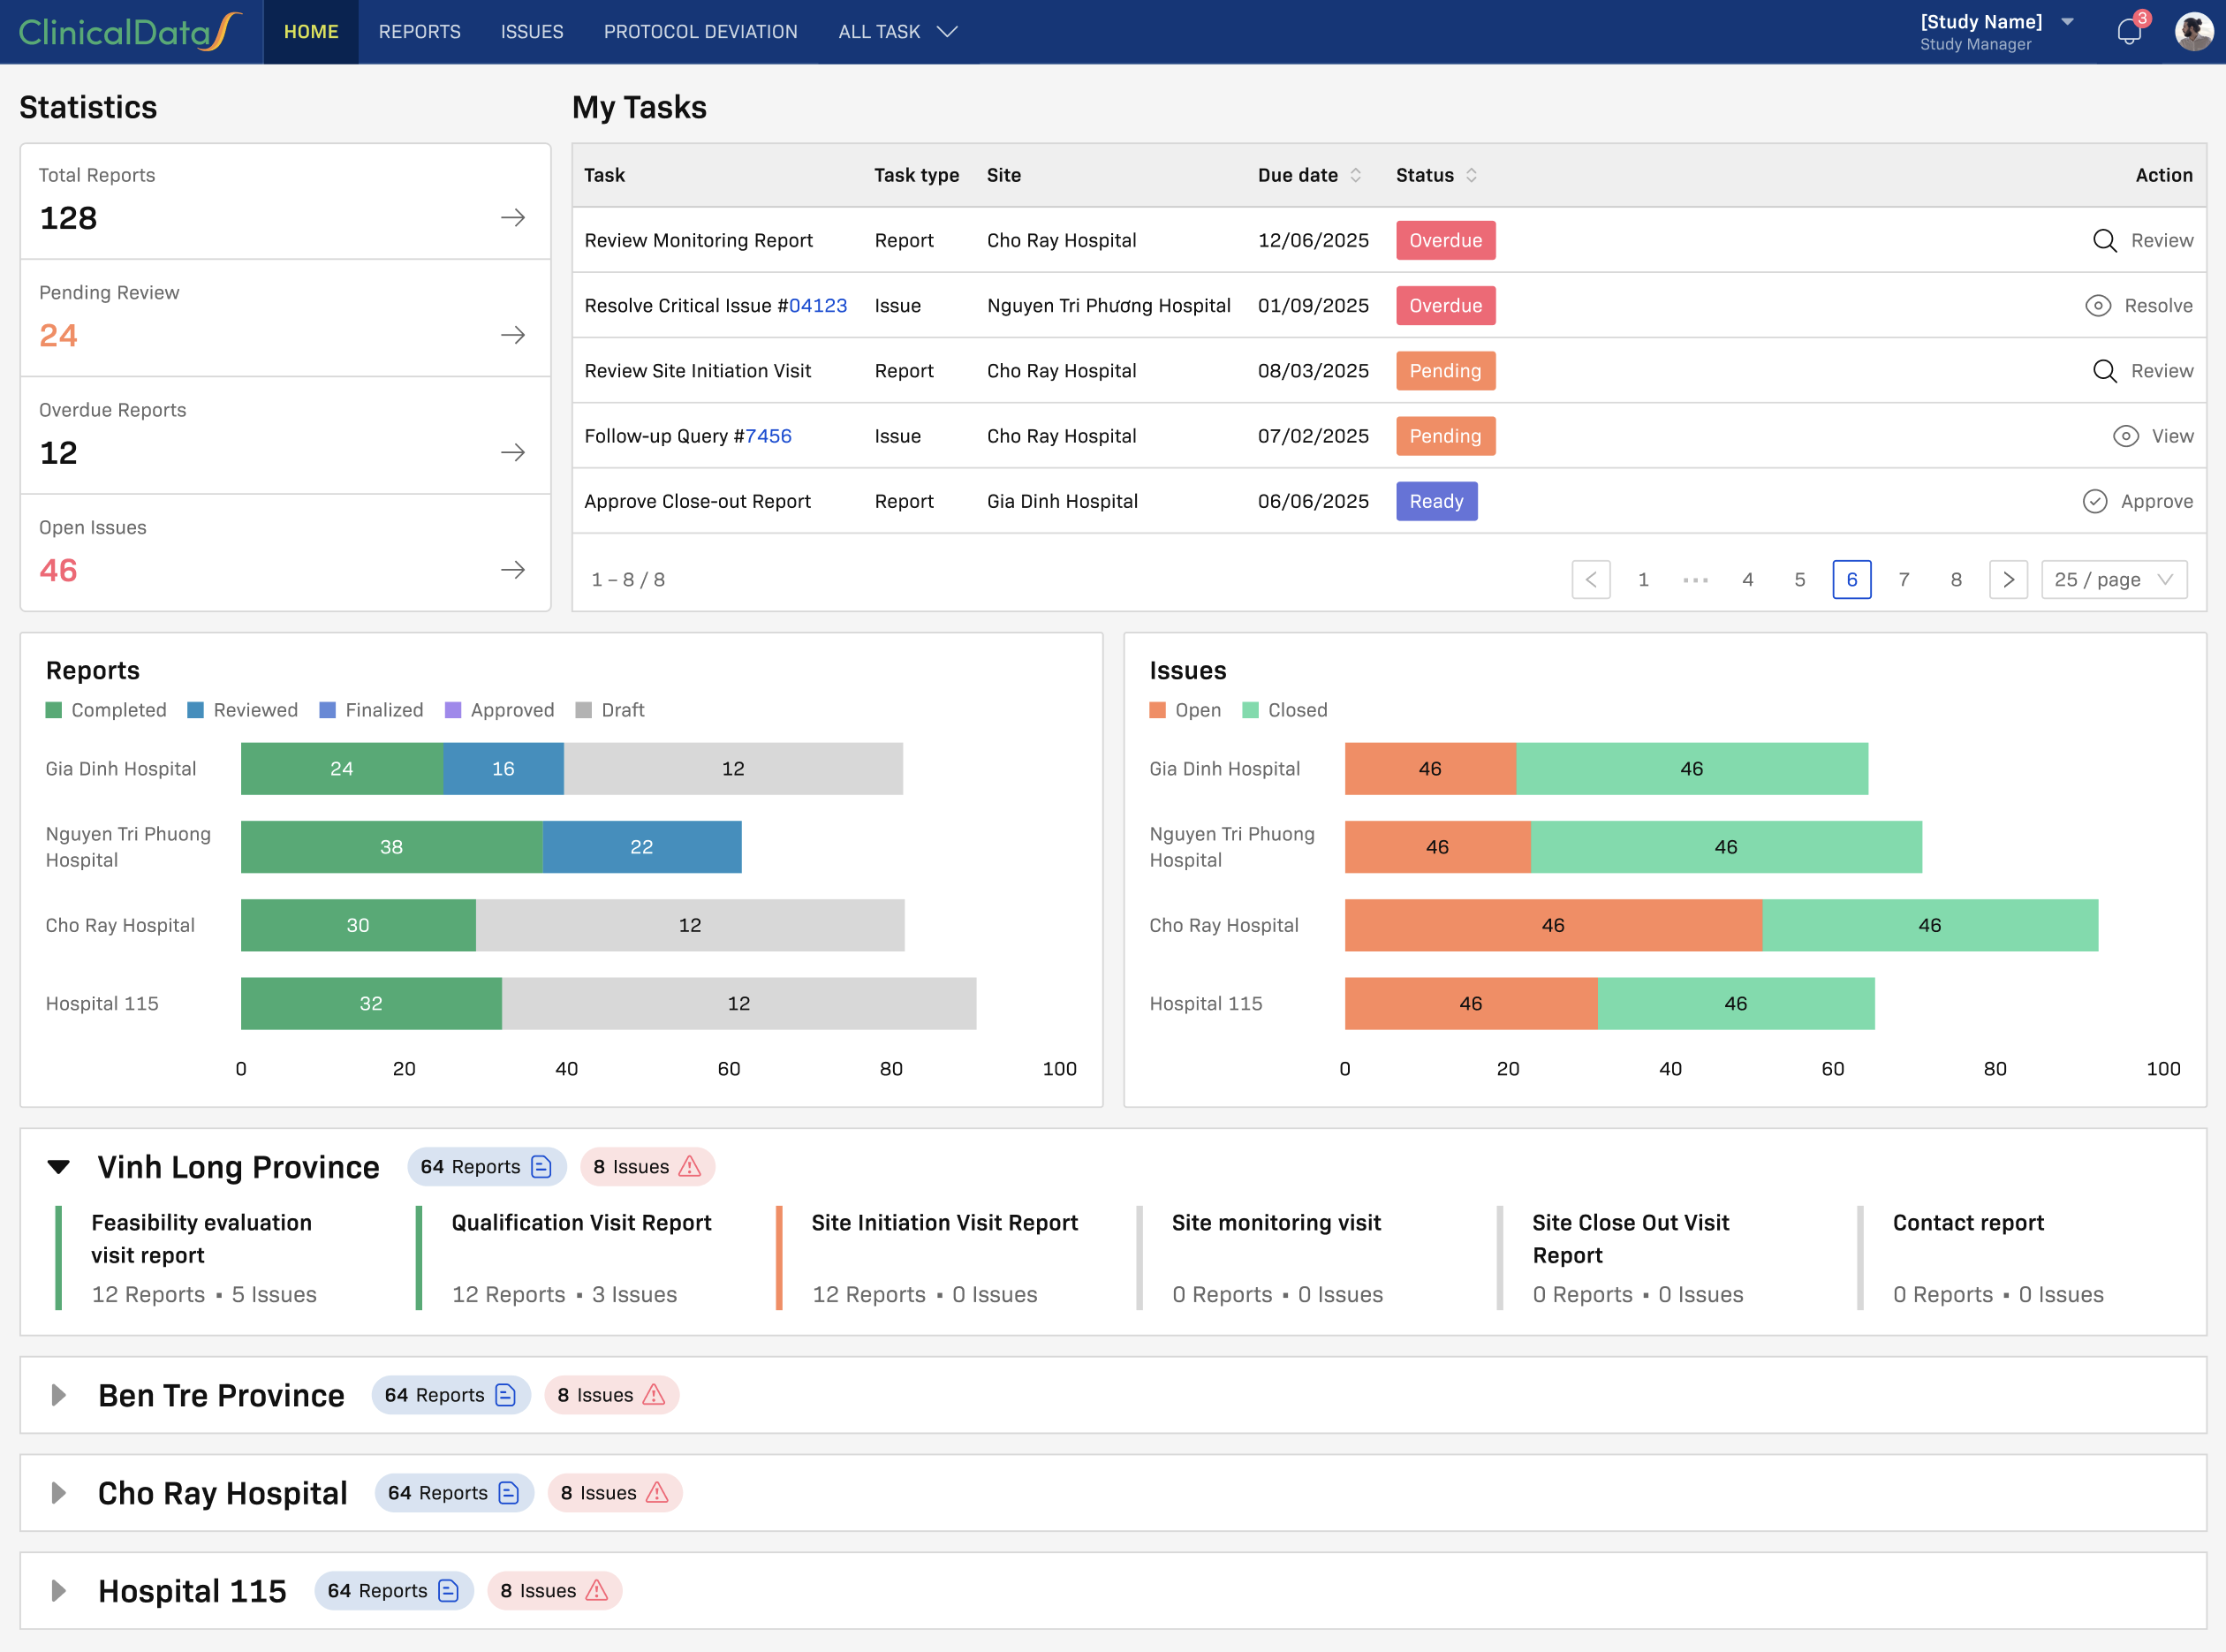
When you open Monitoring Visit, you land on the dashboard. It gives you a cross-site view of monitoring activity.
Sites & Visit Types Panel
For each site, the dashboard shows counters per visit type (e.g., Site Monitoring Visit, Contact Report). Click any counter to open the reports list pre-filtered by that site and visit type.
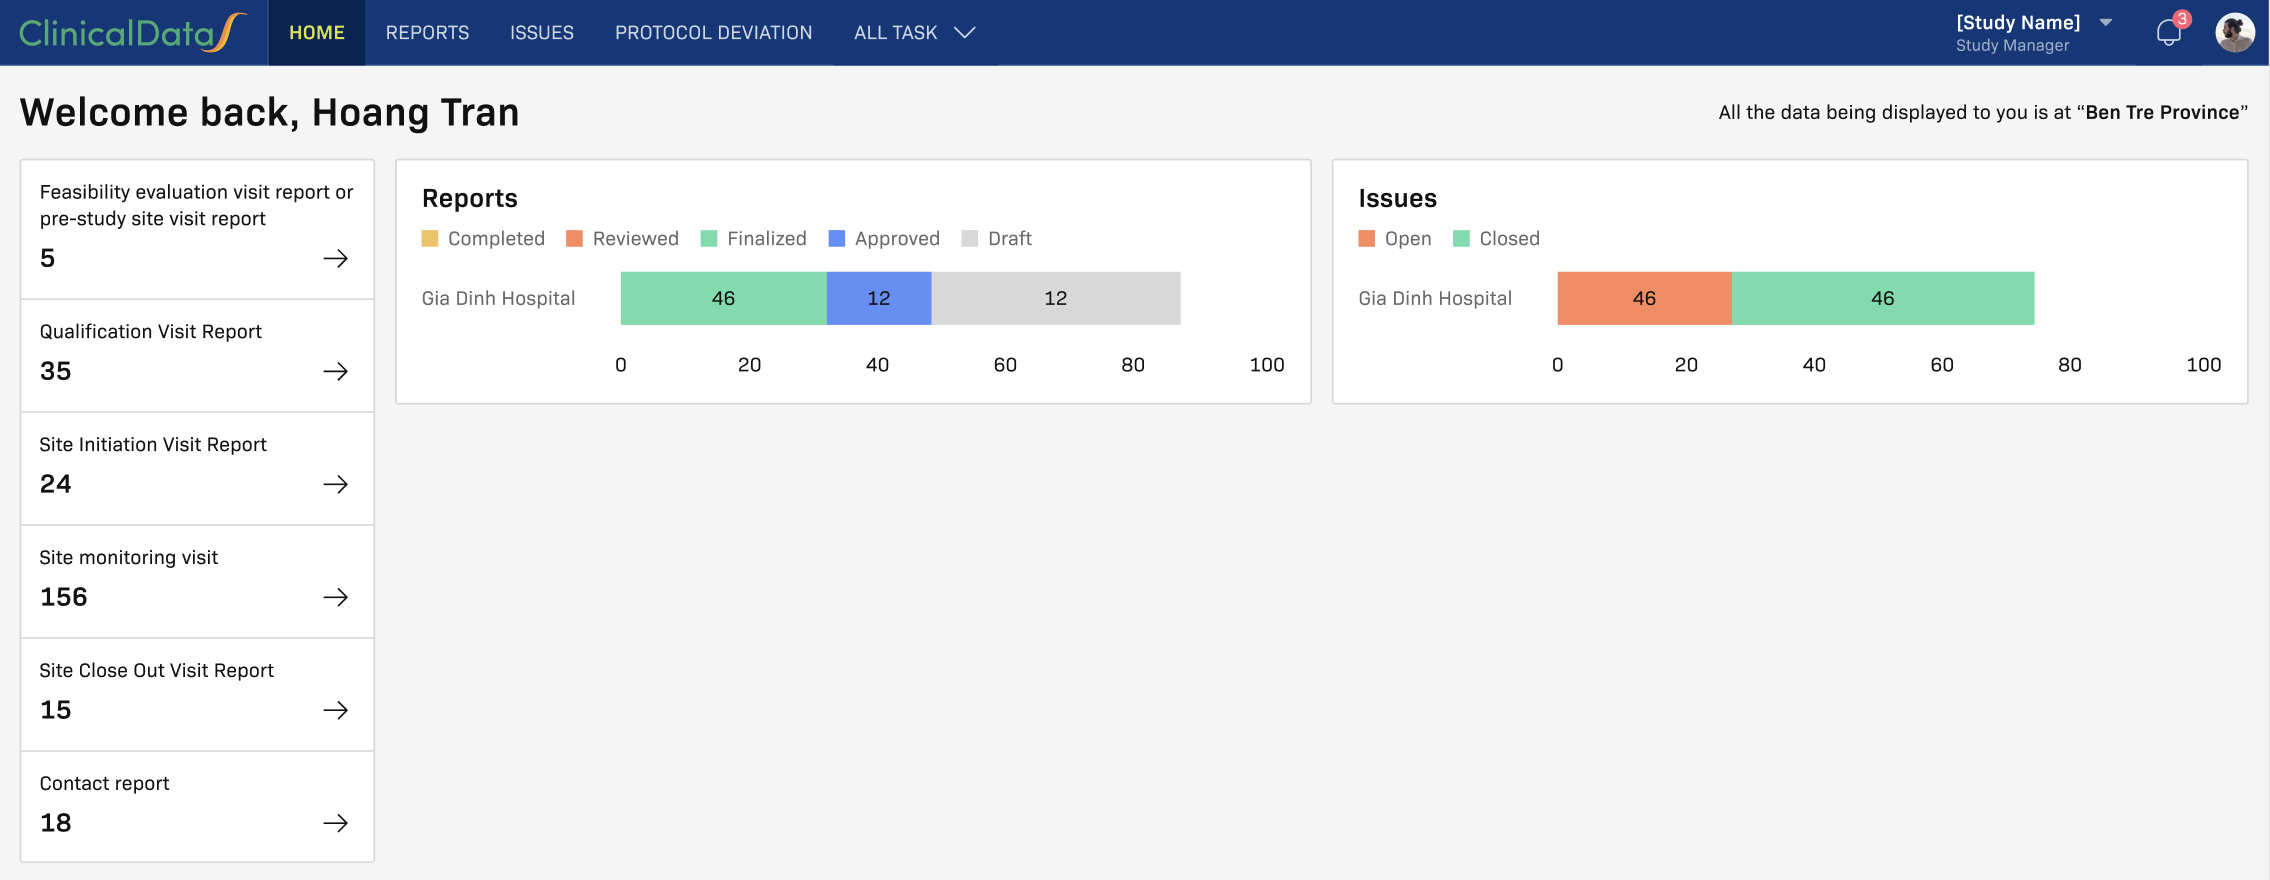
Analytics Widgets
The dashboard includes widgets for:
- Reports — Total count by status
- Issues — Open vs. closed
- Issues By Type — Deviation, Waiver, Violation
- Issues By Level — High, Normal, Low
- Issues By Category — Protocol, GCP, Documentation, etc.
- Issues By Month — Monthly trend
- Open Issues By Aging — How long issues have been unresolved
- Closed Issues By Aging — Time to closure
Reports List
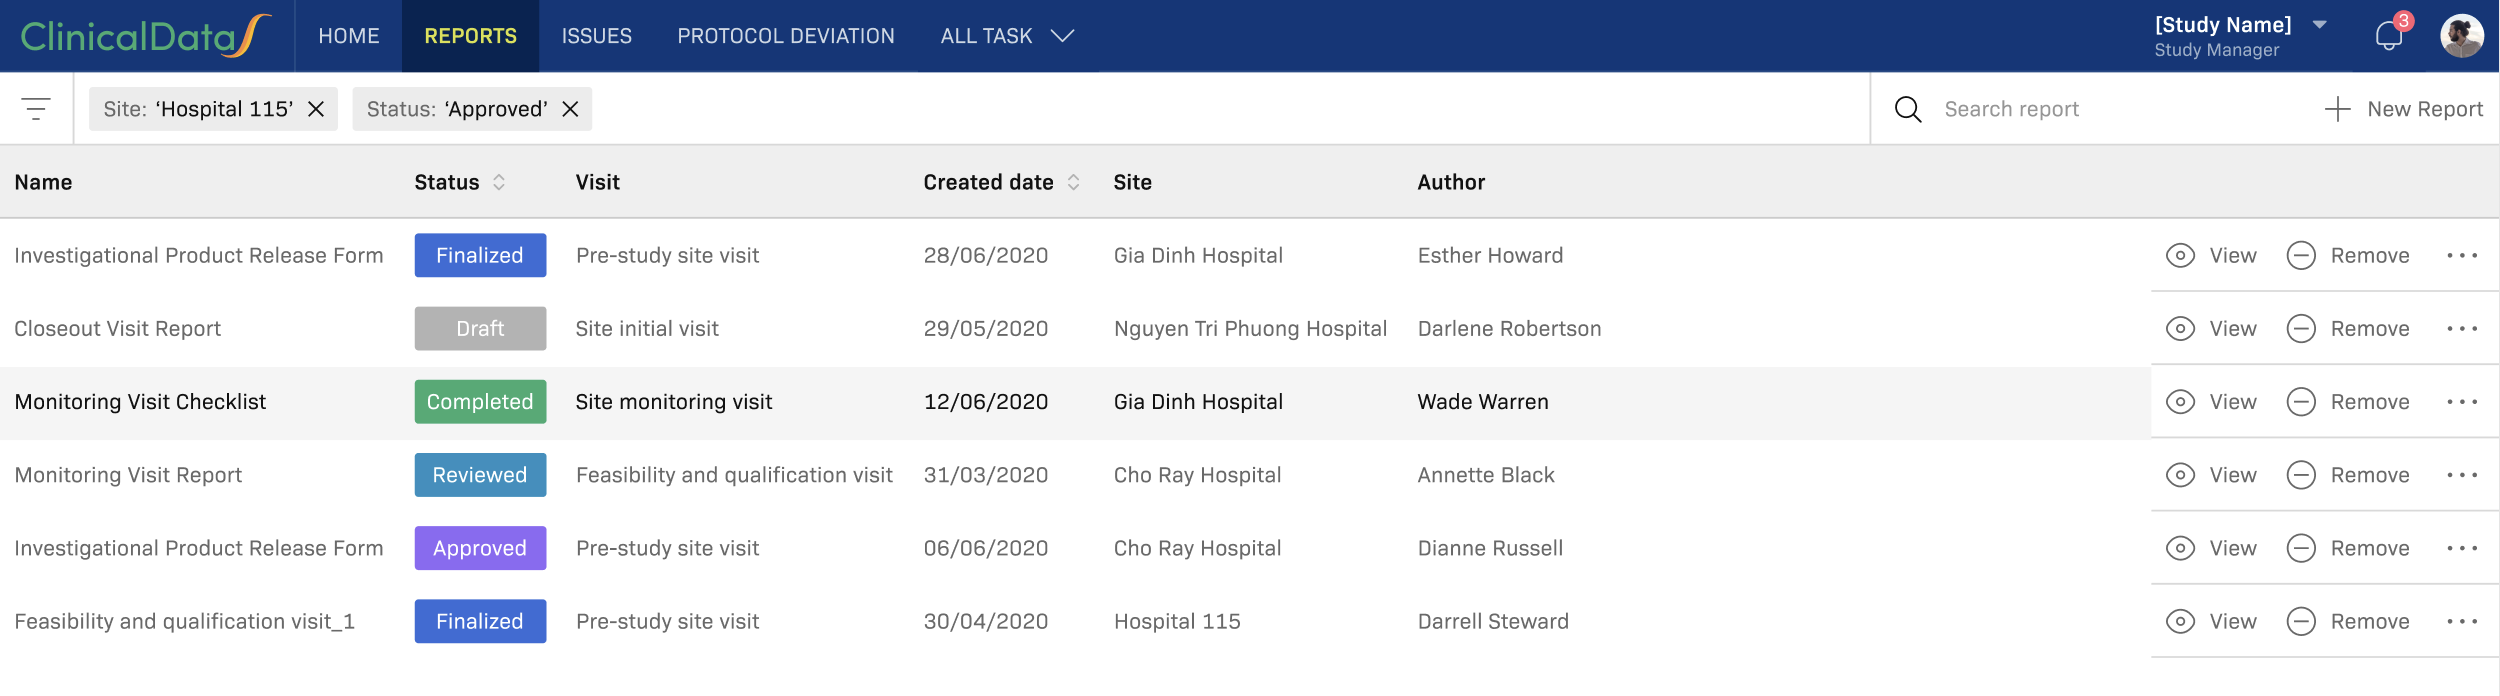
Click a counter on the dashboard to open the reports list, or open it directly from the Monitoring Visit menu.
What You Can Do
- Search by keyword
- Filter by visit type and site
- Refresh the list
- Export as CSV or Excel
- View a report to open its detail
- Download a report as PDF
Understanding the Columns
| Column | Description |
|---|---|
| Name | Report label |
| Status | Draft, Completed, Reviewed, Finalized, Approved |
| Creation Date | When the report was created |
| Latest Updated Date | Last modification |
| Author | Who created the report |
| Site | Which site the report belongs to |
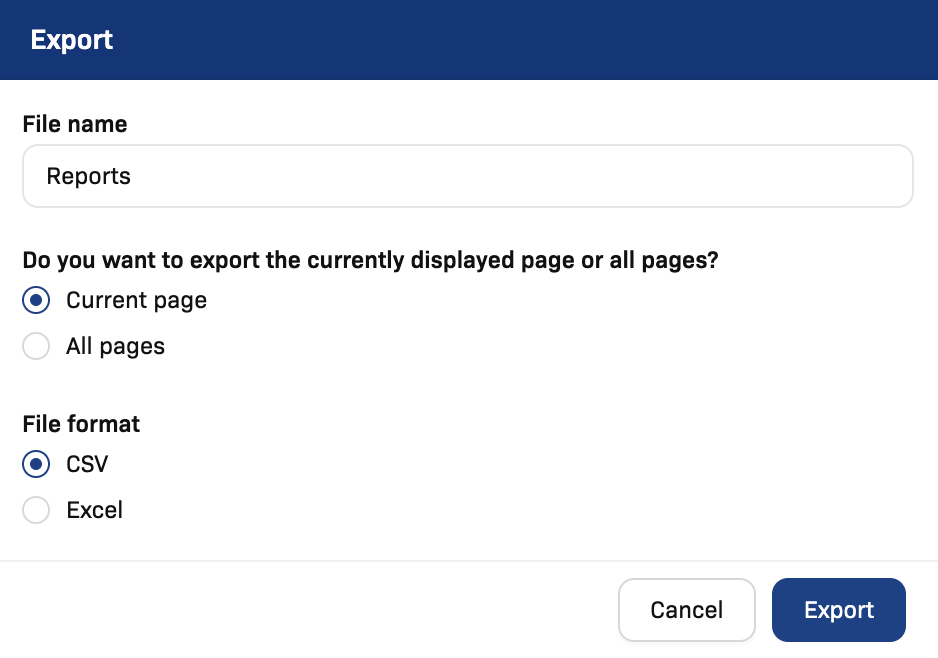
Export Reports
- Click Export as
- Enter a file name
- Choose Export type: Current page or All pages
- Choose File format: CSV or Excel
- Click Export
Creating a Report
- Open the Reports list
- Click Add Report
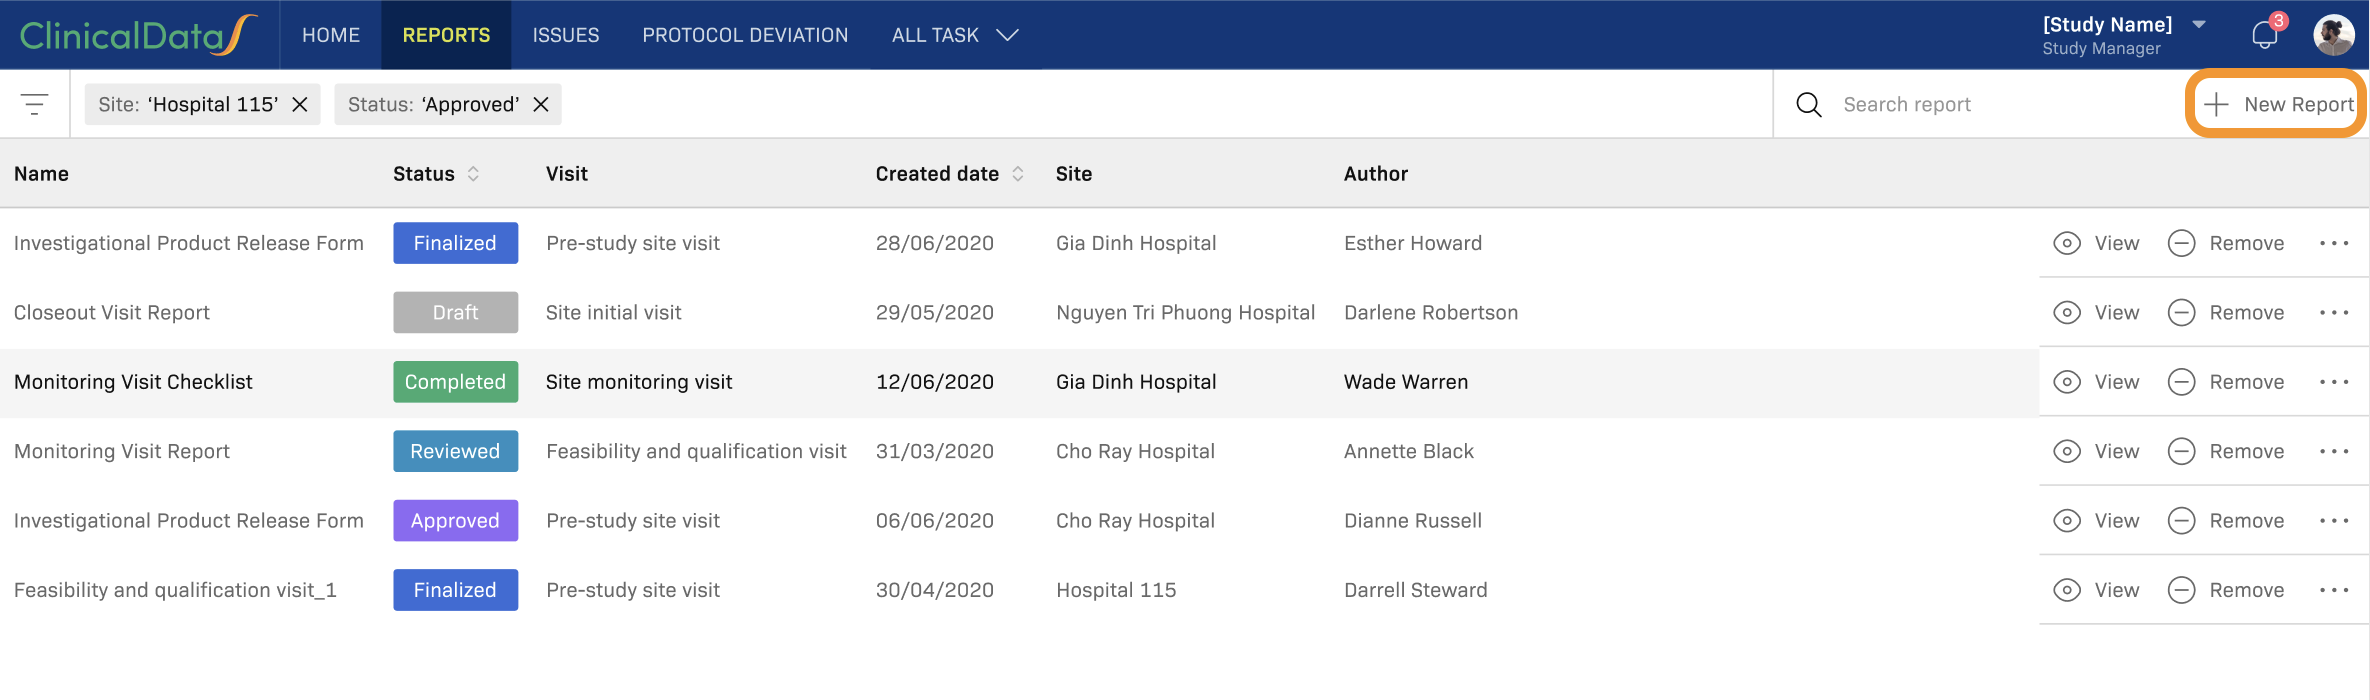
- Select the Site and Visit type
- Click Continue
- The system creates a new report in Draft status and opens the report detail
The system automatically pre-fills:
- Study and site metadata (title, sponsor, protocol, investigator)
- Subject lists, screening failures, discontinuations, SAE summary
- Open queries from EDC
Completing a Report
In the report detail, work through each section:
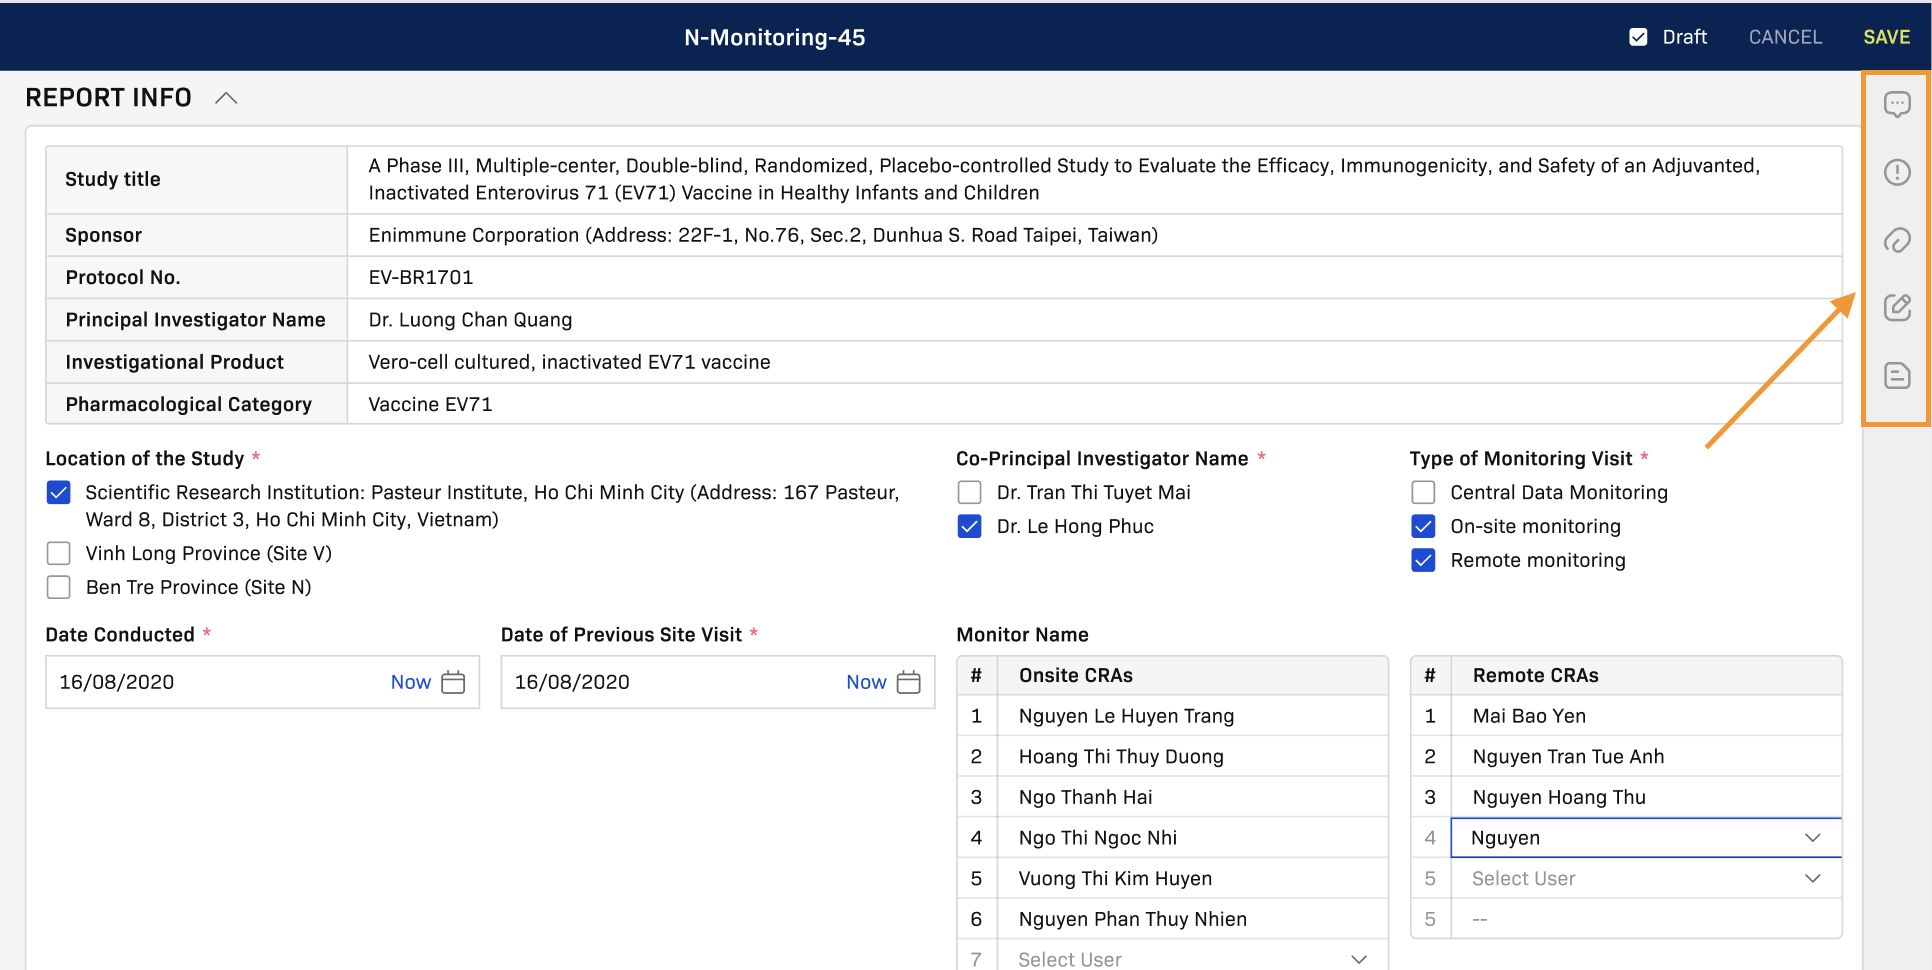
- Fill in the CRF fields for the monitoring visit
- Add Comments, Issues, or Reviews per section using the sidebar actions
- Attach supporting files if needed
- Save your work — the system autosaves draft progress
Status Workflow
Reports move through five statuses:
Draft → Completed → Reviewed → Finalized → Approved
What Each Status Means
| Status | Meaning | Who Moves It Forward |
|---|---|---|
| Draft | Working state — content may be incomplete | — |
| Completed | Content is finished, ready for review | CRA / Monitor |
| Reviewed | Reviewer has checked quality and content | Reviewer |
| Finalized | Report is packaged for sponsor decision | Reviewer |
| Approved | Sponsor has accepted the final report | Sponsor |
Moving a Report Forward
- Open the report in detail view
- Click the status button at the top (e.g., Set as Reviewed, Set as Finalized, Set as Approved)
- Enter a note explaining the decision — this becomes part of the audit trail
- Confirm
Rejecting a Report
If the report isn't ready, click Reject to return it to Draft. Always include a note explaining what needs to be corrected.
Configuration That Affects Daily Use
These settings are configured by your study administrator, but they directly affect your workflow:
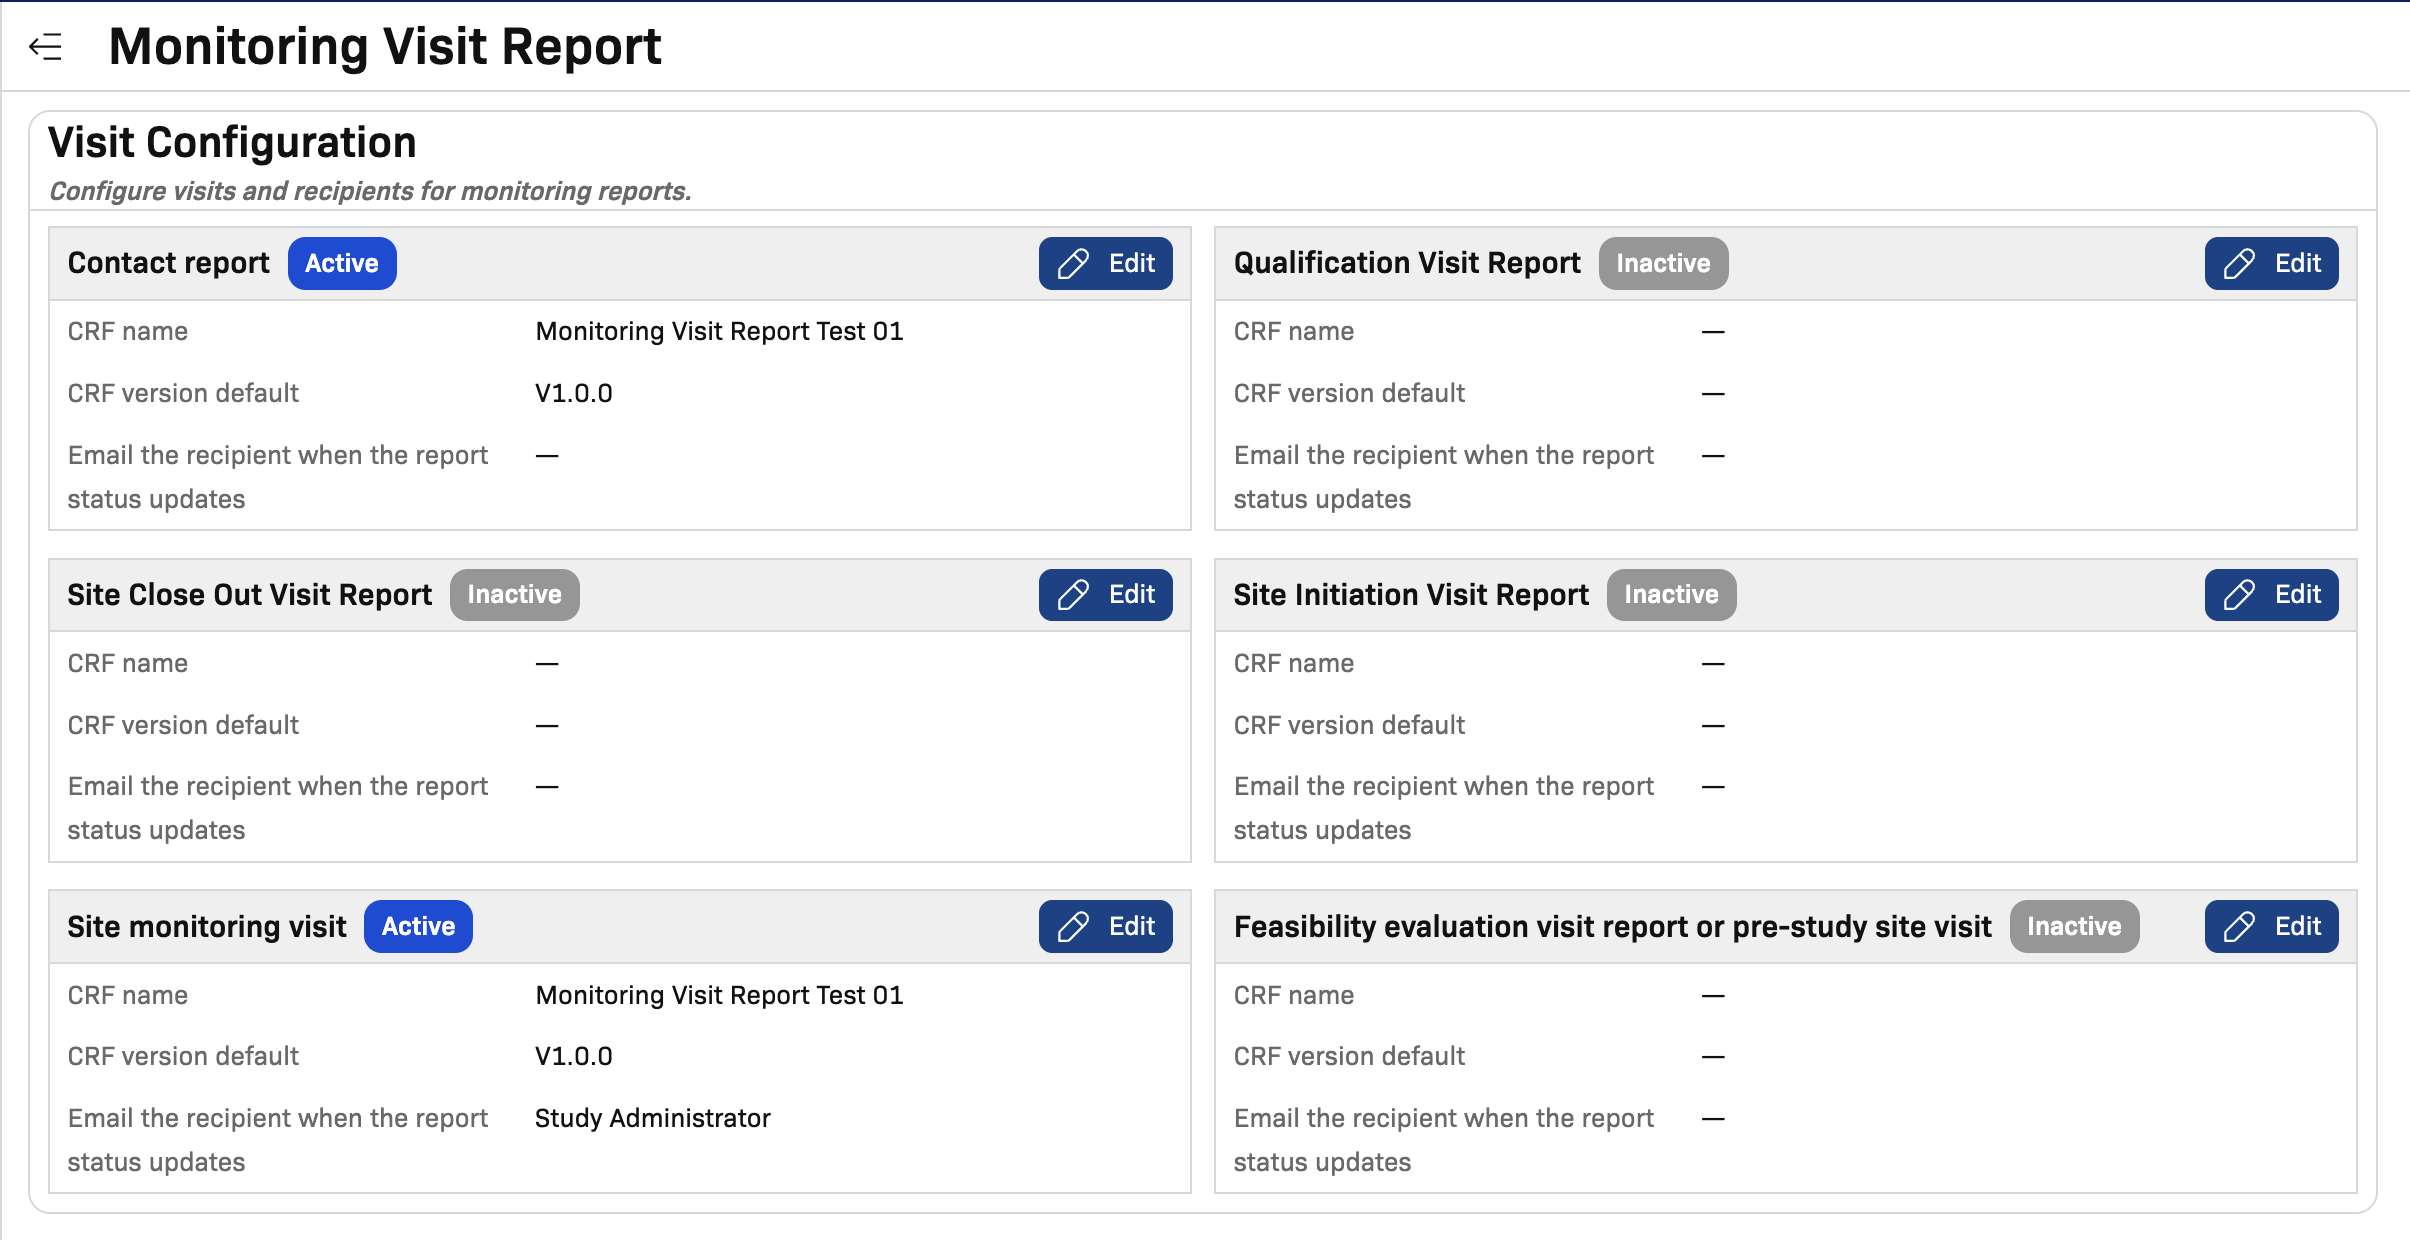
Notifications
Email notifications can be configured per visit type. When a report changes status, the system can notify:
- Role-based recipients (Study Manager, Sponsor, Reviewer)
- Specific individuals (email addresses separated by semicolons)
Visit Type & CRF Mapping
Each visit type must have a CRF name and default CRF version assigned. If these are missing, you won't be able to create new reports for that visit type.
Site Branches
If your organization uses site branches (sub-locations), make sure they're kept up to date for accurate reporting context.
View-Only Mode
If your study is view-only, you'll see a banner:
"This is a view only study. You cannot make any updates to it."
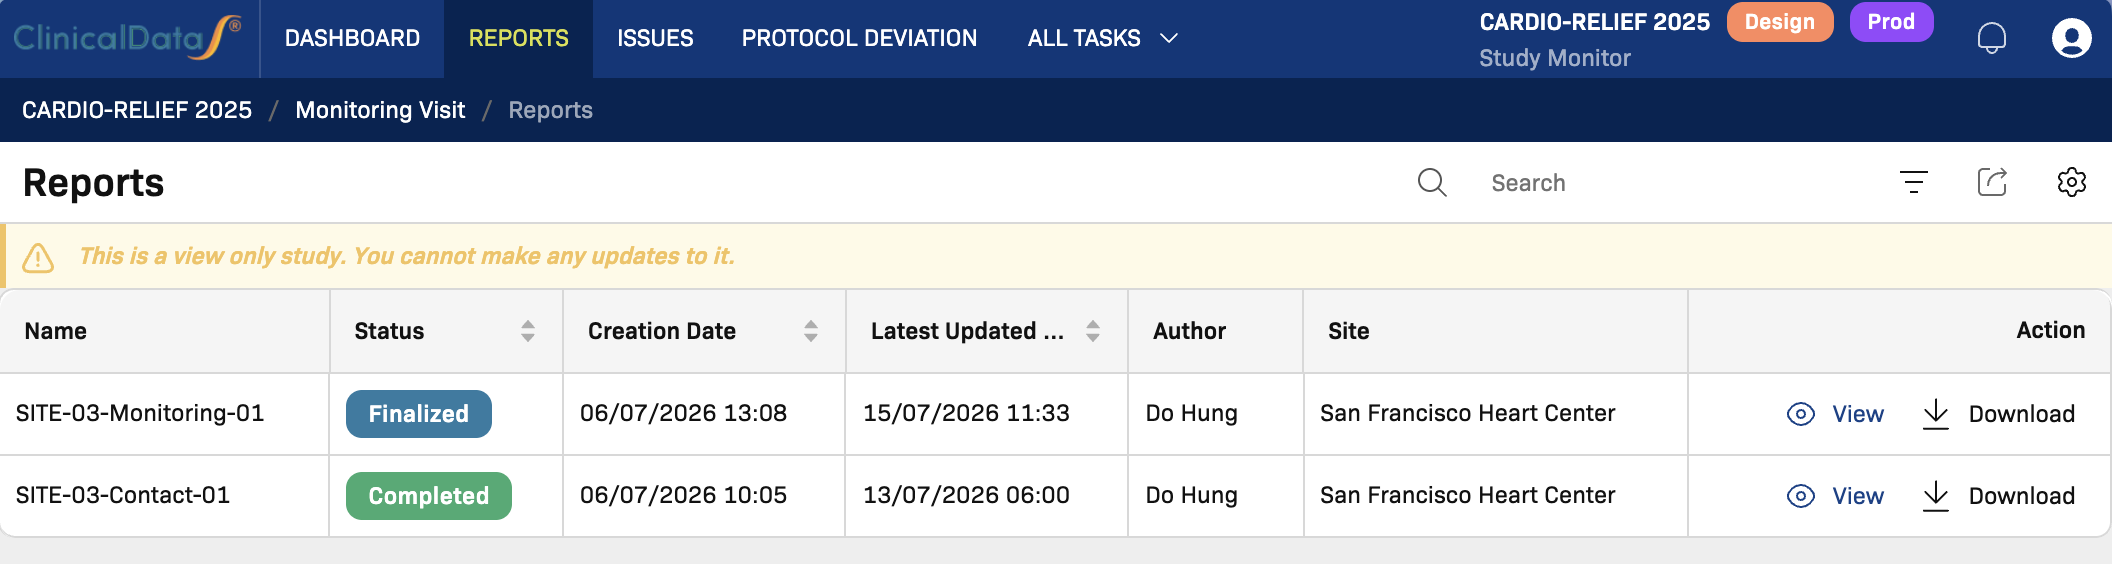
In view-only mode, you can still:
- View the dashboard and analytics
- Search and filter reports
- Export data
You cannot create or edit reports. For training that requires hands-on practice, use a study where you have write permissions.
Issues & Findings
Issues (also called findings) are observations recorded during a monitoring visit that need action or follow-up. They are separate from EDC queries — issues track process-level concerns, while EDC queries track data-level discrepancies.
Issue Attributes
| Attribute | Options |
|---|---|
| Type | Deviation, Waiver, Violation |
| Level | High, Normal, Low |
| Category | Protocol, GCP, Documentation, Consent, Safety, Process, Data |
| Status | Opened, Completed |
Creating an Issue
- Open a report in detail view
- Go to the relevant section
- Click + Add Issue in the sidebar
- Fill in:
- Subject — brief title
- Category — area of concern
- Level — severity
- Type — classification
- Description — detailed observation
- Original Action — initial corrective action
- Click Save
Managing Issues
- Close an issue — Add the updated action, set the resolution date, and click Close Issue
- Reopen an issue — Click Reopen on a closed issue if further action is needed
- Check duplicates — Use Check Duplicate before creating a new issue to avoid redundancy
- Issues Matrix — Access all issues across the study from Monitoring Visit → Issues, filtered by site, type, status, or level
Linking Issues to EDC Queries
When a monitoring finding relates to specific CRF data, you can link it to an EDC query:
- Open a Data Issue
- Select the related Subject, Visit, and Form
- Click Create EDC Query
- The system creates the query in EDC and stores cross-reference IDs
- Query status syncs back to the issue — you'll see it update automatically
One issue can link to multiple EDC queries if clarification is needed across several data points.
SDV During Monitoring
Source Data Verification (SDV) can be done directly within a monitoring visit report.
SDV Statuses
| Status | Meaning |
|---|---|
| Not Started | SDV has not begun |
| Partial | Some items verified |
| Completed | All required items verified |
| Not Applicable | SDV not required |
Performing SDV
- In the report, go to the SDV section
- Select subjects from the study-site subject list
- Mark SDV status per subject, visit, and form by clicking the status button
- Statuses are saved with autosave
SDV Delta View
Compare current SDV status against the previous visit:
- In the SDV section, click View Delta
- The view shows what's newly verified, what changed, and what stayed the same
SDV statuses sync automatically with the EDC dashboard so the data team sees the same information.
E-Signature
Reports require e-signature for final approval.
Before Signing
The system checks that:
- All required sections are completed
- No critical (High-level) issues remain unresolved
- All mandatory fields are filled
- You have e-signature authorization for your role
If any check fails, you'll see a list of items to resolve.
Signing a Report
- Complete all sections and resolve critical issues
- Click Sign Report
- Review the confirmation summary
- Enter your signature reason (e.g., "Site monitoring completed, all findings documented")
- Click Confirm Signature
After signing, the report is locked. The audit trail records who signed, when, why, and a snapshot of the report content.
Reopening a Signed Report
If corrections are needed after signing:
- Click Reopen Report
- Provide a required reason
- After approval, the report returns to Draft status
- All reopen actions are recorded in the audit trail
Only authorized roles can reopen signed reports.
Protocol Deviations & SAEs
Protocol Deviations
View deviations linked to monitoring visits in the Protocol Deviation tab — a read-only matrix showing date, site, subject, category, severity, and description. Deviations are recorded during report creation.
Serious Adverse Events
View SAEs in the same read-only format, tracked per site and subject.
Daily Workflow (CRA / Monitor)
- Open the Monitoring Visit Dashboard
- Review site counters for pending work
- Open reports for high-priority sites
- Create or update reports, keeping drafts current
- Move completed reports through the review workflow
- Notify stakeholders as reports progress through statuses
- Export snapshots when sharing with external parties
- Monitor issue trends from the dashboard